Using GeoTiler Library
Rendering Map
Rendering a map with GeoTiler library consists of two steps
create map object
render map as an image
Map object is created using geotiler.Map class. Its constructor
requires any of the following combinations of map parameters
center, zoom and size
extent and zoom
extent and size
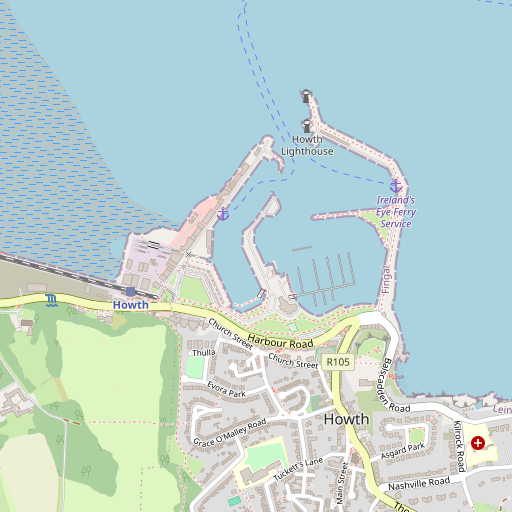
For example, to create map using first combination of the parameters above:
>>> import geotiler
>>> map = geotiler.Map(center=(-6.069, 53.390), zoom=16, size=(512, 512))
>>> map.extent
(-6.074495315551752, 53.38671986409586, -6.063508987426756, 53.39327172612266)
After creating a map object, map can be controlled with extent, center,
zoom and size attributes. Each attribute can influence other, i.e.
changing extent will change map size. Refer to the geotiler.Map
class documentation for details.
Having map object, the map tiles can be downloaded and rendered as an image
with geotiler.render_map() function:
>>> image = geotiler.render_map(map)

The rendered image is an instance of PIL.Image class. Map image
can be used with other library like matplotlib or Cairo to render
additional map information, i.e. points of interests, GPS positions, text,
etc. See 3rd Party Libraries section for examples.
Alternatively, the map image can be simply saved as a file:
>>> image.save('map.png')
Asynchronous Map Rendering
The asyncio Python framework enables programmers to write asynchronous, concurrent programs using coroutines.
GeoTiler allows to asynchronously download map tiles and render map image
with geotiler.render_map_async() asyncio coroutine.
Very simple example to download a map using asyncio framework:
>>> coro = geotiler.render_map_async(map)
>>> loop = asyncio.get_event_loop()
>>> image = loop.run_until_complete(coro)
We include more complex example below. It reads location data from gpsd daemon, renders the map at the centre of current position and saves map to a file. There are two concurrent tasks running concurrently
location reading
map tiles downloading and rendering
The tasks communication is done via a queue holding current position.
async def read_gps(queue):
    """
    Read location data from `gpsd` daemon.
    """
    reader, writer = await asyncio.open_connection(port=2947)
    writer.write(b'?WATCH={"enable":true,"json":true}\n')
    while True:
        line = await reader.readline()
        data = json.loads(line.decode())
        if 'lon' in data:
            await queue.put((data['lon'], data['lat']))

async def show_map(queue, map):
    """
    Save map centered at location to a file.
    """
    while True:
        pos = yield from queue.get()

        map.center = pos
        img = await render_map_async(map)
        img.save('ex-async-gps.png', 'png')


size = 800, 800
start = 0, 0
mm = geotiler.Map(size=size, center=start, zoom=16)

queue = asyncio.Queue(1)        # queue holding current position from gpsd

# run location and map rendering tasks concurrently
t1 = show_map(queue, mm)
t2 = read_gps(queue)
task = asyncio.gather(t1, t2)
loop = asyncio.get_event_loop()
loop.run_until_complete(task)
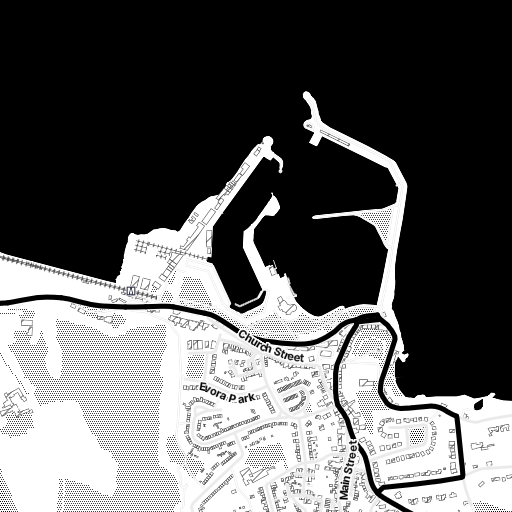
Map Providers
GeoTiler supports multiple map providers.
The list of supported map providers is presented in the table below. The default map provider is OpenStreetMap.
Provider
Provider Id
API Key Reference
License
OpenStreetMap
osm
Stamen Toner
stamen-toner
stadiamaps
Stamen Toner Lite
stamen-toner-lite
stadiamaps
Stamen Terrain
stamen-terrain
stadiamaps
Stamen Terrain Background
stamen-terrain-background
stadiamaps
Stamen Terrain Lines
stamen-terrain-lines
stadiamaps
Stamen Water Color
stamen-watercolor
stadiamaps
Modest Maps Blue Marble
bluemarble
OpenCycleMap
thunderforest-cycle
thunderforest
A map provider might require API key. To add an API key for a map provider, the $HOME/.config/geotiler/geotiler.ini file has to be created with API key reference pointing to an API key, for example:
[api-key]
thunderforest = <api-key>
where <api-key> is usually a fixed size, alphanumeric hash value provided by map provider service.
Identificators of GeoTiler map providers can be listed with
geotiler.providers() function. Map provider identificator can be
used with geotiler.find_provider() function to create instance of
map provider or it can be passed to geotiler.Map class
constructor:
>>> map = geotiler.Map(center=(-6.069, 53.390), zoom=16, size=(512, 512), provider='stamen-toner')
>>> image = geotiler.render_map(map)

# or

>>> map = geotiler.Map(center=(-6.069, 53.390), zoom=16, size=(512, 512))
>>> map.provider = geotiler.find_provider('stamen-toner')
>>> image = geotiler.render_map(map)

3rd Party Libraries
Map image rendered by GeoTiler can be used with other library like matplotlib or Cairo to draw additional map information or use the map in data analysis graphs.
GeoTiler implements various examples of such integration. The examples are presented in the subsections below.
Cairo Example
import cairo
import logging
import math

logging.basicConfig(level=logging.DEBUG)

import geotiler

bbox = 11.78560, 46.48083, 11.79067, 46.48283

#
# download background map using default map tiles provider - OpenStreetMap
#
mm = geotiler.Map(extent=bbox, zoom=18)
width, height = mm.size

img = geotiler.render_map(mm)

#
# create cairo surface
#
buff = bytearray(img.convert('RGBA').tobytes('raw', 'BGRA'))
surface = cairo.ImageSurface.create_for_data(
    buff, cairo.FORMAT_ARGB32, width, height
)
cr = cairo.Context(surface)

#
# plot circles around custom points
#
x0, y0 = 11.78816, 46.48114 # http://www.openstreetmap.org/search?query=46.48114%2C11.78816
x1, y1 = 11.78771, 46.48165 # http://www.openstreetmap.org/search?query=46.48165%2C11.78771
points = ((x0, y0), (x1, y1))
points = (mm.rev_geocode(p) for p in points)
for x, y in points:
    cr.set_source_rgba(0.0, 0.0, 1.0, 0.1)
    cr.arc(x, y, 30, 0, 2 * math.pi)
    cr.fill()

surface.write_to_png('ex-cairo.png')
matplotlib Example
import matplotlib.pyplot as plt

import logging
logging.basicConfig(level=logging.DEBUG)

import geotiler

bbox = 11.78560, 46.48083, 11.79067, 46.48283

fig = plt.figure(figsize=(10, 10))
ax = plt.subplot(111)

#
# download background map using OpenStreetMap
#
mm = geotiler.Map(extent=bbox, zoom=18)

img = geotiler.render_map(mm)
ax.imshow(img)

#
# plot custom points
#
x0, y0 = 11.78816, 46.48114 # http://www.openstreetmap.org/search?query=46.48114%2C11.78816
x1, y1 = 11.78771, 46.48165 # http://www.openstreetmap.org/search?query=46.48165%2C11.78771
points = ((x0, y0), (x1, y1))
x, y = zip(*(mm.rev_geocode(p) for p in points))
ax.scatter(x, y, c='red', edgecolor='none', s=10, alpha=0.9)

plt.savefig('ex-matplotlib.pdf', bbox_inches='tight')
plt.close()
Matplotlib Basemap Toolkit Example
import matplotlib.pyplot as plt
from mpl_toolkits.basemap import Basemap

import logging
logging.basicConfig(level=logging.DEBUG)

import geotiler

bbox = 11.78560, 46.48083, 11.79067, 46.48283

fig = plt.figure(figsize=(10, 10))
ax = plt.subplot(111)

#
# download background map using OpenStreetMap
#
mm = geotiler.Map(extent=bbox, zoom=18)

img = geotiler.render_map(mm)

#
# create basemap
#
map = Basemap(
    llcrnrlon=bbox[0], llcrnrlat=bbox[1],
    urcrnrlon=bbox[2], urcrnrlat=bbox[3],
    projection='merc', ax=ax
)

map.imshow(img, interpolation='lanczos', origin='upper')

#
# plot custom points
#
x0, y0 = 11.78816, 46.48114 # http://www.openstreetmap.org/search?query=46.48114%2C11.78816
x1, y1 = 11.78771, 46.48165 # http://www.openstreetmap.org/search?query=46.48165%2C11.78771
x, y = map((x0, x1), (y0, y1))
ax.scatter(x, y, c='red', edgecolor='none', s=10, alpha=0.9)

plt.savefig('ex-basemap.pdf', bbox_inches='tight')
plt.close()
Caching
GeoTiler allows to cache map tiles. The
geotiler.cache.caching_downloader() function enables us to adapt
any caching strategy.
Beside generic caching downloader adapter, GeoTiler provides Redis store adapter. While it requires Redis server and Python Redis module installed, such solution gives map tiles persistence and advanced cache management.
The Redis cache example illustrates how Redis can be user for map tiles caching.
import functools
import redis

import geotiler
from geotiler.cache import redis_downloader

import logging
logging.basicConfig(level=logging.DEBUG)

# create tile downloader with Redis client as cache
client = redis.Redis('localhost')
downloader = redis_downloader(client)

# use map renderer with new downloader
render_map = functools.partial(geotiler.render_map, downloader=downloader)

bbox = 11.78560, 46.48083, 11.79067, 46.48283
mm = geotiler.Map(extent=bbox, zoom=18)

# render the map for the first time...
img = render_map(mm)

# ... and second time to demonstrate use of the cache
img = render_map(mm)

# show some recent keys
print('recent cache keys {}'.format(client.keys()[:10]))