Commandline Tools
DecoTengu library provides two commandline applications.
The dt-lint command prints dive decompression information and allows to
store dive profile steps data in a CSV file.
The dt-plot command plots dive profile steps data in the form of PDF
file.
Calculating Dive Decompression Data
To calculate decompression information of a dive to 40m for 35 minutes on air use the following command:
$ dt-lint 40 35
Dive profile:  40m for 35min
Descent rate: 20.0m/min
Ascent rate: 10.0m/min

GF Low: 30%
GF High: 85%
Surface pressure: 1013.25 millibar

Gas list:
 o2=21% at 0m

Decompression stops (ZH-L16B-GF):
   21m   1min
   18m   1min
   15m   2min
   12m   5min
    9m   7min
    6m  14min
    3m  25min
-------------
Sum:    55min
The dive profile steps data can be saved using -f option. An example
of saving the data into dive.csv file with dive steps calculated every
minute:
$ dt-lint -f dive.csv -t 1 -gl 20 -gh 90 -l '21,0@0 50,0@21 100,0@6' 40 35
Dive profile:  40m for 35min
Descent rate: 20.0m/min
Ascent rate: 10.0m/min

GF Low: 20%
GF High: 90%
Surface pressure: 1013.25 millibar

Gas list:
 o2=21% at 0m
 o2=50% at 21m
 o2=100% at 6m

Decompression stops (ZH-L16B-GF):
   24m   1min
   21m   1min
   18m   1min
   15m   1min
   12m   2min
    9m   4min
    6m   4min
    3m   8min
-------------
Sum:    22min
Plotting Dive Decompression Data
Once dive profile steps data is saved in a CSV file, the dive profile can
be plotted with dt-plot command:
$ dt-plot dive.csv dive.pdf
The output, PDF file, contains plots for each of 16 tissues described by Buhlmann model
first page contains summary for each tissue compartment
second page has plot for leading tissue compartment data (presented on figure Leading tissue data plot)
next pages contain plots for each tissue compartment
The plots show pressure value at given time of a dive. There are four lines on the plot
- blue
Pressure of dive depth.
- black
Pressure of inert gases in a tissue compartment.
- orange
Tissue pressure ceiling limit as implied by current gradient factor value. For example, when GF low set to 30% and GF high set to 90%, gradient factor value is 30% until first decompression stop and then it changes lineary to 90% until the surface.
- red
The maximum tissue pressure limit as required by Buhlmann model (or at 100% gradient factor value).
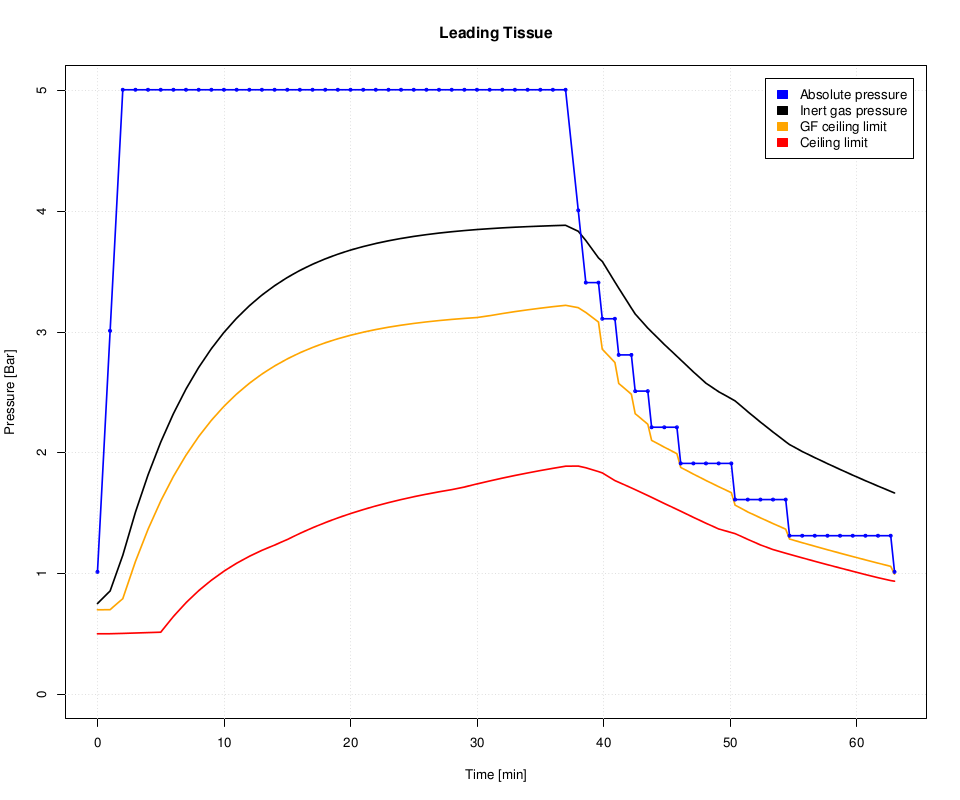
Leading tissue data plot
Comparing Dive Decompression Data
The dt-plot script allows to compare two dive profiles, i.e. to
visualize differences between two decompression models, decompression model
parameters or various gas mix configurations.
For example, to compare two dive profiles for ZH-L16B-GF and ZH-L16C-GF decompression models:
$ dt-lint -f dive.csv -t 60 -gl 20 -gh 90 -l '21,0@0 50,0@21 100,0@6' 40 35
$ dt-lint -f dive-c.csv -m zh-l16c-gf -t 60 -gl 20 -gh 90 -l '21,0@0 50,0@21 100,0@6' 40 35
$ dt-plot dive.csv dive-c.csv dive.pdf
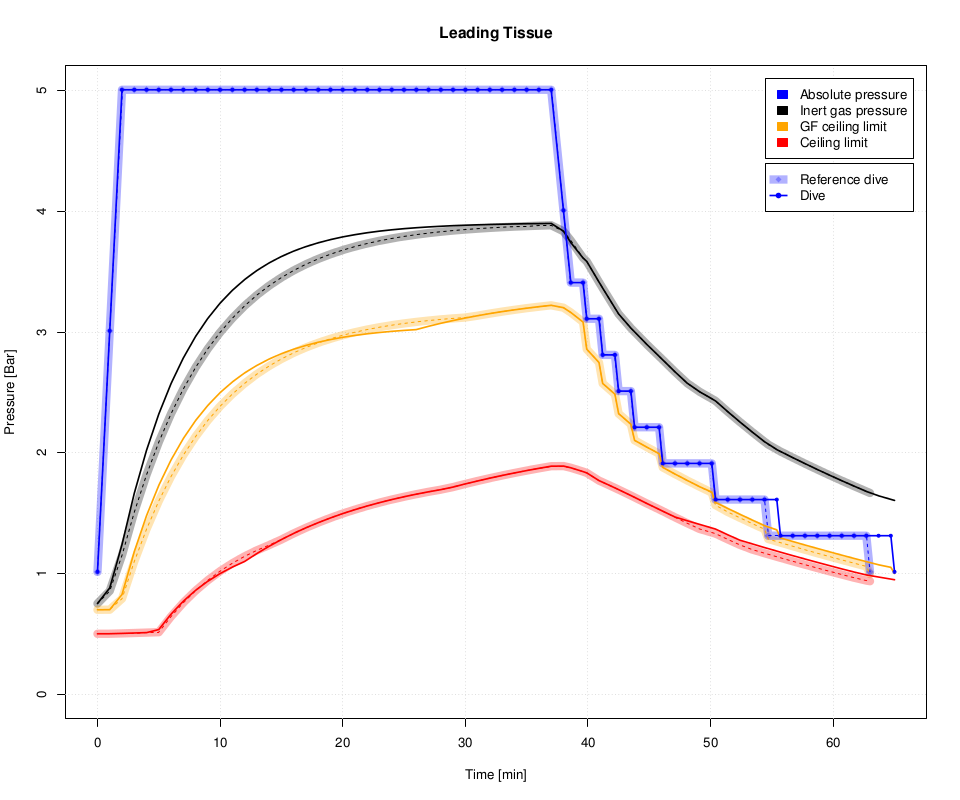
Comparison of leading tissue data between ZH-L16B-GF and ZH-L16C-GF